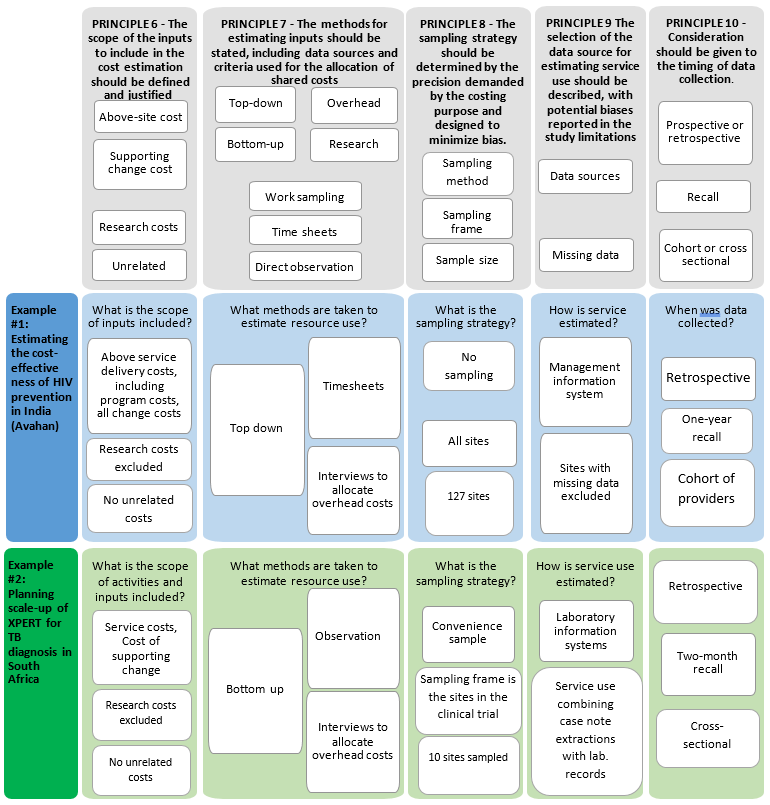
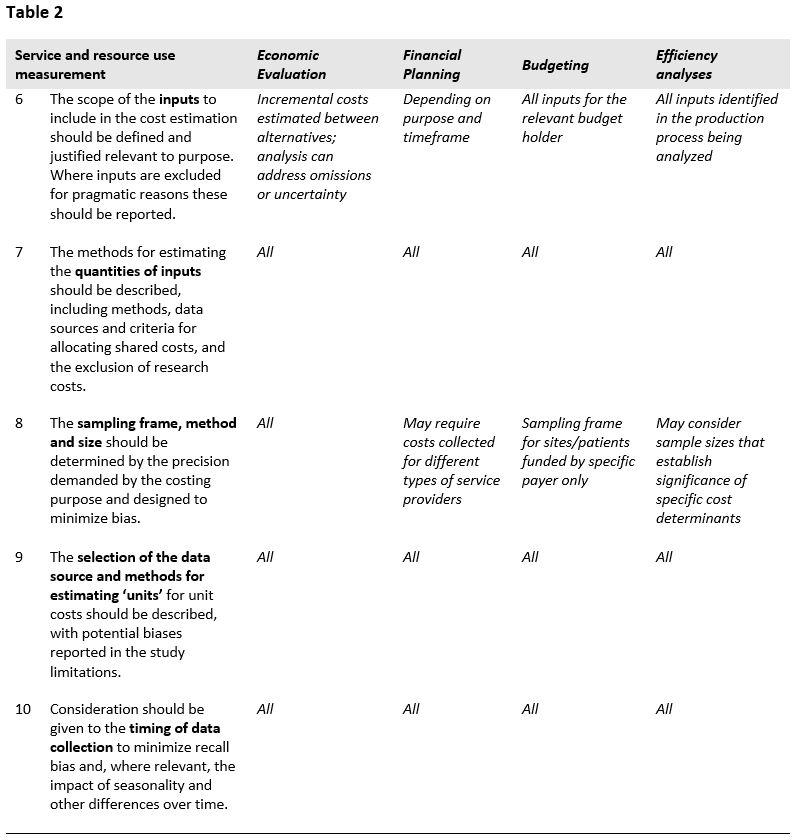
The second part of the Reference Case focuses on resource use measurement, and the methods used to capture the quantities of resources used to provide an intervention and/or service/output. Five principles are defined, represented in Table 2 and in the figure at the end of the section.
Being transparent and justifying the scope of the cost estimate in terms of which inputs are included is critical for comparability and can allow others to determine bias. The risk of bias from excluding components of cost (e.g., program administration, a personnel category, or off-site support) leading to inappropriate conclusions from costing studies is well recognized and one of the core challenges in cost estimation26.
The list of inputs to be included in the cost estimate will, in the first instance, be defined by purpose, perspective, timeframe and type of cost being estimated. For example, inputs such as volunteer time may be omitted where only financial costs are relevant (see principle 14 below). However, additional omissions may also occur as analysts balance the cost of data collection with potential bias from omitted inputs. While omission of items may be a practical necessity where expenditure or other records are not available on certain costs, it is essential that any deviation between the ideal scope according to purpose made, due to lack of data availability, is reported ‒ so that bias can be ascertained.
There is a range of methodological guidance that can be used to comprehensively identify the inputs associated with an intervention and/or service/output. These commonly build from a description of the production process (principle 1 above). Both providers and patients can be involved, and there are formal methods that may be employed to map the full range of resource use associated with production27. In the first instance, analysts should use these tools to identify important inputs. In addition, in some cases, analysts may know of the cost structure from prior studies and can make informed judgments as to where primary data collection is most beneficial. Many studies also first pilot data collection instruments in a few sites to determine data availability and improve their understanding of the time and cost required to collect data on different inputs. All of these practices are recommended where feasiblef.
Where economic costs are estimated, it is essential that all costs are considered, excluding those that do not change between interventions. Resources that are sunk or not currently used to full capacity should be considered as incurring opportunity costs, if they can be used for other services. For example, if a new diagnostic requires more staff time compared to an existing diagnostic, the cost of this additional staff time should be included, irrespective of whether current staff are fully utilized. The same applies for shared resources such as management information systems. If the capacity of the shared resource used by the new intervention is also flexible enough to use for other purposes, then it has an opportunity cost. The extent of flexibility will be context and resource specific.
There are also some resources that are commonly excluded on arbitrary grounds, and should not be. Recent reviews of studies28 where above service delivery costs have been included demonstrate that these costs can form a substantial part of intervention costs and yet are often not considered. “Above (delivery) site” activities include various support services provided by the central administration (e.g., Ministry of Heath) such as training, education and outreach, demand generation campaigns and central laboratory services. Most cost studies exclude these costs, or where they do include them, use inconsistent measurement methods. It is recommended that these costs should be considered in the same way as on-site costs, rather than arbitrarily omitted. Having said this, accessing data on above service costs can be a challenge. If a measurement process can’t be feasibly implemented then the omission should still be clearly stated, and any bias reported.
A further area that warrants specific mention is the costs of supporting change. The costs of many interventions are estimated for rapid and substantial scale-up in low- and middle-income countries, and the associated costs of implementing change may also be important. Examples include the costs of changing guidance on drugs regimens, providing health systems strengthening to enable managers to reorganize services, or production of health workers to support scale-up of interventions. Some analysts may also choose to include the costs of intervention development, while some consider these as sunk costs. These inputs should be included where relevant.
Where costs are estimated for economic evaluation or long-term financial planning, there is currently no consensus on whether future costs should be included, nor is there strong evidence of their importance, so they may be omitted. Nevertheless, analysts should state (if the costing includes future costs) whether unrelated costs are omitted as well as any methods for projecting future costs, and discuss any resulting bias in their projections or results. For analyses seeking to include future costs, it may be advisable to include both the health care costs directly related and unrelated to the specific condition being addressed by the intervention. For example, when working out the costs of a program that keeps those persons with TB or HIV alive, analysts may wish to consider the costs of treating any future illness29.
Finally, when estimating incremental costs, determining the scope of the additional cost of the intervention to the comparator can be challenging30. There is no consensus methodological recommendation in this area. However, studies that compare different methods, for example statistical methods or the use of mechanistic cost models to estimate costs attributable to both the comparator and the intervention, find that the method chosen influences results31,32. In low- and middle-income settings, an important consideration is the extent to which the intervention and any comparators can be absorbed within existing under-capacity within the health system. If analysts adjust costs to consider spare capacity in the health system, they are therefore recommended to report any assumptions about existing capacity when describing the scope of ‘incremental’ cost.
The methods used to estimate the levels of inputs used in an intervention can bias estimates, and therefore should be reported. Broadly, analysts can select either a gross- or micro-costing approach, or a combination of both. Gross costing is defined as a process by which input use is estimated in total, and micro-costing where the analyst aims to estimate the usage of each input separately. In general, micro-costing tends to be more comprehensive and capture more input usage, with studies that compare micro- and gross costs finding that gross estimates tend to underestimate costs33.
In the introductory material in this Reference Case it is highlighted that allocating costs between intervention is a challenge, and where the data is available it may be advisable to estimate total costs and derived incremental or marginal costs using econometric methods. However, in most circumstances, analysts need to design an allocation method for joint costs. The choice of using bottom-up or top-down allocation methods has also been shown to affect both the cost estimate and its applicability. While gross costing is done top-down (usually total costs divided by service unit levels), micro-costing may use both approaches to allocating resources. Bottom-up methods use approaches such as observation to estimate levels of input usage for a service, whereas top-down methods focus on allocating out the total amount of inputs used in facility, ward or clinic between services. Differences in cost estimates using bottom-up compared to top-down approaches are due both to measurement issues34 and to differences in the included inputs35. Top-down methods may capture some inputs where resource use cannot be observed due to demand or seasonal factors, for example, electricity. Top-down methods may also better capture inefficiency or down time and wastage. In comparison, bottom-up approaches allow for more understanding of individual service provision and may better characterize variation in practice36. They may also identify inputs that would be missed in a top-down allocation of costs, by improving the analysts’ understanding of the production process.
In addition, there is increasing evidence that above service and overhead costs, which may have been conventionally allocated using simple ‘top-down’ techniques, may require more complex allocation approaches, given the substantial proportion of these costs for some global health interventions37. The choice of allocation methods may also be particularly important when costing hospital care38. One option to improve accuracy is to use techniques such as step-down methods39 or activity-based costing. These methods first assign costs to departments and/or activities; costs at the departmental and/or activity level are then assigned to services. This step-down approach is recommended by some rather than using person-hours directly working on the service as typically done in micro-costing40-42. In some cases, it may also be possible to use regression methods and matched comparisons to identify costs for a particular service, where total costs are available for sites (and patients) with and without the intervention43,44.
Human resources often make up the largest proportion of cost of global health interventions. Yet, health professionals, including community health workers, are often working in different services such as clinic and outreach settings. Measuring the human resources spent on an intervention is therefore one of the most important and challenging aspects of cost estimation and can substantially influence results.
Finally, a further important issue is the allocation of costs between research settings and real-world interventions. Many cost estimates for novel interventions are conducted in trial or demonstration settings. There is an extensive literature highlighting the limitations of using cost estimates from these settings to model the costs of intervention implementation in the ‘real world’. While many cost estimates carefully remove research costs, the difference between ‘research’ and ‘implementation’ costs can be hard to define. Those conducting cost estimates will need to make judgments/obtain information about how the intervention is likely to be implemented in the real world, for instance, whether or not an activity will be implemented, the frequency of activities, and the type of inputs – e.g., human resources – and include this in their assumptions. For example, activities such as ‘routine monitoring’ may change substantially if the intervention were scaled up.
Moreover, it may be easy to remove items such as survey costs but harder to determine the costs of any adjustments made to the intervention design for research purposes. For example, trials commonly need to conduct additional activities to ensure protocol adherence or to reduce loss to follow up. Thus, the intervention cost during a trial may create a distorted estimate45. Even where these activities can be distinguished, research site selection may be biased46 and have different levels of efficiency than other sites. In some cases, costs can be adjusted to reflect real-world inefficiencies47. Finally, researchers can use input prices for inputs that will be used in real life rather than input prices in the trial. For instance, rather than use researcher/trial implementer salaries, they could use public sector health-worker salaries or average health-worker prices to reflect the likely costs on scale-up.
It should be noted that although the removal of research costs is desirable for some purposes, there are exceptions. In the case of economic evaluation, the effect size observed (and then used in the incremental cost-effectiveness ratio) may in part be due to research-driven activities. If these costs were removed, then this would change and bias the incremental cost-effectiveness ratio. Whether or not analysts choose to include research costs in their estimates, clear disaggregation between research and non-research costs should be regarded as a minimum standard.
While micro-costing is seen as a gold standard by some, we do not recommend it in this Reference Case as a minimum methodological specification. In many cases, the required level of disaggregation for levels of use by input may be unnecessarily onerous, or gross costs may be available from routine systems that have already been validated. Micro-costs are, however, particularly useful in situations where costs may need to be disaggregated and routine systems are weak. Moreover, the disaggregation of cost components allows for adaptation of costs to other settings and can assist the assessment of heterogeneity across patient groups48.
In practice, many analysts use a mixed-methods approach. For example, a recent guideline for disease-specific costing, which was applied in Nigeria, combines micro-costing for some elements with more feasible gross costs for others49. Given the burden of data collection and the need to capture all resource use, bottom-up measurement may not be required for all inputs. Those cost components that have the greatest impact on costs (labor and inpatient stay) may warrant more accurate allocation methods50. Analysts should therefore state the allocation method used for each input, including clearly describing if these are ‘top-down’ or ‘bottom-up’.
In all cases, the methods/criteria used to allocate shared resources should reflect usage of each input and should be explicit. Where allocations have been made ‘top-down’, either to sites or within sites to services, or above service delivery or overhead costs have been allocated, the criteria used and the relevant data sources of the allocation factors should be explained. The bias inherent in any data source used to allocate input usage should aim to reduce bias. For example, recall by medical staff of time spent on intervention activities may be accurate when the intervention occurs in large regular blocks, such as every Tuesday morning. However, staff recall may be unreliable when the intervention activity is interspersed with other responsibilities in irregular ways. In such instances, an appropriate contemporaneous recording of activities using “time and motion” or work sampling methods may provide more precise data51,52. There is mixed evidence as to whether this sort of continuous observation may also influence behavior, leading to biased measurement53,54.
More specifically, careful attention should be paid to methods used to allocate human resource costs. Several methods are commonly employed to estimate time spent on a service or interventions. These include focus group discussions, interviews with providers or patients, examining patient records, time sheets, direct observation of practice, and work sampling. There is no ‘gold standard’ as each of these methods has biases. Several of the methods are subject to ‘self-reporting’ or ‘observer’ bias that may result in more ‘desirable’ behavior. All methods may be subject to incompleteness. Approaches relying on patient records or reporting may not fully capture non-contact time (such as management and supervision costs), whereas approaches relying on self-reporting may be overly burdensome and may be under-reported in busy periods.
Where costs are collected as part of research into an intervention, research costs should be included, with the exception of when these costs could enhance the effectiveness of the intervention, and the costs are being estimate for an economic evaluation. Given the variety of methods, and the lack of a ‘gold standard’, the methodological specification for allocating costs, including human resource and research costs, focuses on reporting, and aims to ensure that biases are considered when designing the data collection method. A comprehensive description of methods, data sources, and allocation criteria by input should be reported for any cost estimate.
Depending on the purpose of the cost estimation, the sampling frame may involve the selection of countries, geographical regions within countries, sites within regions, patients within sites, and different client groups. The purpose will also determine the appropriate sampling method and size. For example, some financial planning processes will require the collection of data from different site types. For economic evaluation, the aim is usually to compare the ‘intervention’ with the ‘comparator’ and this will determine the method used.
Due to logistical challenges and budget constraints, most cost estimates in low- and middle-income countries have been typically conducted on a small number of sites or locations (<10), though in recent years, larger studies have emerged, particularly in HIV. Where large studies have occurred, they have demonstrated a high variation of costs, suggesting that the common practice of estimating costs on a small sample may produce highly unrepresentative results55. However, even if a few sites are selected, explicit consideration (and transparency) of the sampling frame and method can help others apply cost estimates to other settings.
Guidance on determining the optimal sampling approach for cost estimation is scarce, and therefore the methodological specification for this principle focuses on transparency and encouraging explicit consideration of each element the sampling approach, in line with recommended practice on sampling more generallyg.
First, any sampling should begin with a sampling frame of sites or the population from which the sample is to be taken. In some cases, where a list of sites is unavailable, it is necessary to conduct an inventory of sites/facilities in order to come to a sampling frame. Even if random sampling or other methods cannot be used, the sampling frame can assist analysts in describing the bias in any eventual sample.
The sampling strategy will depend highly on the purpose of costing; in some cases, obtaining representative data is not the priority or the sample may be pre-identified for political reasons. However, most costing efforts will aim to obtain cost data that is representative at a regional or national scale, in order to facilitate planning or decision-making. Given the high costs and logistics of data collection, cost estimation frequently employs convenience sampling methods. However, these are likely to be biased, and techniques such as stratified sampling by facility size/type/ownership (or funding) and type of location (urban vs. rural) may offer practical alternatives to provide more representative data. Sampling strategies should avoid convenience sampling wherever possible, aiming instead for a random or stratified approach. Even where convenience is an issue, techniques to avoid bias should be considered (for example, random sampling within convenient locations). In some cases, purposive or stratified sampling will be preferred (for example where costs are used for financial planning and scale up across different facility types), or maximum variation sampling where costs bounds are of interest. Finally, where cost data is being collected from individuals, it may be more pragmatic to sample clusters of individuals, rather than individuals. In all cases the sampling methods chosen should be clearly explained and justified.
Cost data is generally highly skewed, and may therefore require a larger sample to obtain precise estimates. However, due to the lack of clarity as to what level of precision is acceptable for specific purposes, it remains unclear whether or when large sample sizes should be considered standard practice, and difficult to recommend specific methods of sample size calculation. Having said this, in many cases it may be feasible and appropriate to formally determine sample sizes. In economic evaluation, methods have been developed to establish a threshold level of difference in cost-effectiveness between the intervention and the comparator56,57. Studies on efficiency may use a sample size calculation based on establishing the significance of particular determinants of costs. Likewise, in TB programs, the sample size of national patient cost surveys supported by the World Health Organization was determined using an ‘acceptable’ level of precision around the extent of change over time of catastrophic costs. Guidance may also be drawn from the literature around sampling for multi-country studies that compare different sampling approaches (for example for cross country studies – whether few sites and more countries is more efficient than the converse58). As with the frame and sampling method, the approach to establishing the sample size should be described and justified.
Many unit cost studies need to estimate the unit costs from total expenditures, or they may need to measure quantity of the inputs being valued. Depending on the methods used, the approach may vary. For some studies, the top-down method may be used for some inputs. For example, an analyst may have the cost of overall expenditures from an X-ray department, and may need to divide by the total number of X-rays. In other instances, someone estimating the costs of treatment may need data on the number of visits or services accessed by patients.
Much of the costing methods literature from high-income countries focuses on methods used to estimate service utilization. This need for methods guidance has arisen due to limits of using routine systems, particularly where patients are seeking care from multiple providers, including private providers. While some interventions are ‘one-stop’, in many areas they require multiple and complex service and technology use. In some cases, aggregate data (such as the number of patients completing TB treatment) may be available from routine systems, yet the numbers of visits/services utilization may not be, or where it is, it may be biased or incomplete. Of specific concern is where performance is either judged or incentivized based on routine reporting because these systems may be biased by over-reporting, leading to an underestimation of unit costs.
It is hard to define a ‘gold standard approach’ for primary data collection that can be applied universally to health service utilization, community outreach, and general population-based behavior change campaigns. The literature from high-income countries comparing agreement in estimates from medical records, encounter logs, and patient reports may provide insights on an approach for low- and middle-income countries. Some have argued that medical record extraction is the gold standard, but in many low- and middle-income country settings these records may not be available or of suitable quality, or may be held by the patient. In other cases, service providers keep logbooks that may provide a useful source of data, however these data sources in different departments are not linked. Understanding patient flows and where events are documented is key in developing a data collection strategy that minimizes double counting and/or incompleteness of records. Others recommend patient interviews, the use of diaries or a resource-use log59. There is some evidence suggesting a high degree of convergence among methods60. But others point to the fact that even where there is agreement between records and patient self-reporting, there are different omissions (with patients reporting more service use for core providers such as GPs, but less service use for non-core providers such as pharmacies)61. Other studies have found that patients may also misclassify use62.
Moreover, different populations may exhibit different biases in terms of self-reported service use. One study found over-reporting amongst men and those with higher frequency of visits63. Elderly patients may under-report64. There are particular issues for the very sick and for children regarding the reliability of reporting by their guardians. Finally, responses may be different for different types of services. Reporting may be reliable for services like hospitalizations, but less so for general outpatient visits65. It may also be easier for patients to report visits, but not the use of medications and other care products66, particularly for chronic disease where longer-term recall is an issue.
There are often trade-offs between accuracy and precision when selecting the appropriate method. Some propose regular phone surveys since they reach larger populations and hence can improve precision67, but these may have poorer reporting than face-to-face interviews. Where people are insured, claims data may be an option. Claims data (as with other routine reporting systems) can cover longer periods and larger samples but may cover fewer cost categories68. Simpler methods such as Delphi panel estimation using focus groups may also be considered where resources are too constrained for patient surveys69.
In summary, there is no ‘gold standard’ approach, but it is important to consider characteristics of the sample population, their cognitive abilities, recall timeframe (see below), type of utilization, and frequency of use70. Comparing data from different sources may improve comprehensiveness of results. In some cases it may be useful to adopt formal analytical approaches to address biases caused by misreporting or incomplete data71. The methodological specification is therefore to report the source of data, report the approach used to sample or fill missing data and justify why the approach was selected given the potential for bias described above. Further research on this topic is needed to identify the best approach in LMIC settings.
There are several issues to consider when deciding upon the timing of data collection. The first issue is whether data on resource use should be collected prospectively or retrospectively. Prospective data collection is often preferable, as it allows for direct observation of resource use and avoids issues associated with recall bias or missing/incomplete records. However, while prospective data collection may be more comprehensive and unbiased, there is a risk that the data collection methods may influence resource use72. Alternatively, retrospective data collection may be sufficient and more practical if relevant written records are available to track the way resources are allocated and any recall period is kept to a minimum.
Where input and service use data are collected directly from clients or patients, several factors may also impact the quality of the resulting cost estimate; these include recall timeframe and utilization frequency70. Several studies have examined how accurately patients recall service use. Some suggest that a two- to three-month recall period can provide reliable estimates73, but point to differences amongst different types of health service use. In some cases, a shorter recall period does not provide adequate information on health service use, especially where events are infrequent74. For example, for studies concentrating on hospitalizations, the recall period may be longer75, but for community services, there may be under-reporting as the recall period is extended (four to eight months)76.
In comparison, little is known about the accuracy of recall for health care workers, and this is likely to vary depending on characteristics of the time use (e.g., two half-day sessions per week vs. intermittent 10- to 15-minute blocks scattered throughout the work week).
In addition to deciding whether resource use will be collected prospectively or retrospectively, it will therefore be important to consider the frequency of data collection over the course of the intervention being assessed. For many interventions, consideration should be given to the variation in costs across the project period as well as recall bias. For example, in addition to capturing costs during start-up vs. ongoing operations, other factors may affect the costs during the course of a year. In particular, seasonal fluctuations in service use may result in under- or over-estimation if costs are measured for less than one year.
In general, analysts should clearly describe any limitations associated with the timing of data collection. Analysts should consider whether retrospective versus prospective data collection is most appropriate, and whether the costs of the intervention and/or service/output will evolve over time. Where data is collected from patients/clients at different points in time, analysts should report whether this was cross sectional or a cohort. Where data is collected from interviews, consideration should be given to recall period, and where recall periods are longer than three months, these should be justified. For interventions where provision or service use may exhibit seasonal variation, a minimum of one year’s period of cost measurement should be captured through either ongoing record-keeping or intermittent data collection efforts. In line with the principle on time horizon, for new programs, and especially demonstration projects or pilots, it will be important to time data collection to capture costs during both the start-up and implementation phases of the project, as these may differ substantially. In terms of frequency of data collection, it will be important to obtain information on resource use at the start of the project to capture start-up costs, followed by a field visit after the intervention has been running for three to six months to collect resource use for recurrent costs. Depending on seasonality and other factors affecting the supply and demand of services, subsequent visits may be needed to capture changes in service volume and resource use over the course of the project period.